A study of representational bias - Happy Faces project
Introduction
I recently did a small project using deep learning to recognize happy
facial expressions 1. Then I read Chapter 03 from Deep Learning For Coders 2 which is about ethics in machine learning. I went through different emotions like fear and sadness seeing that how some good or even great work may later result in wide spread negative consequences if we are not careful and do necessary measures from the very beginning of the process. It also gave hope that analyzing the project through an ethical lens can also lead to better successful project.
So I decided to do a little project to see how my model works on different categories like skin color, age groups and gender from a learning perspective. This is an exercise in learning and understanding bias in deep learning rather than a comprehensive experiment to derive conclusions.
Aim
To study the prediction accuracy across different categories such as skin color, age groups, and gender.
Method
Test images are downloaded using python duckduck_search module. Queries different from those used while obtaining images for training/validation are employed here in an attempt to obtain new images. While training the model the images were cropped around the faces for simplicity and because we were interested in the facial expression identification. 100 images in each category are considered. Inference is carried out on each image. Accuracy is calculated as the average number of true positives for a given label.
Results
Gender
The first category we’ll explore is gender; we’ll consider the behavior of the model prediction for pictures of male and female faces. For the happy
label the accuracy is plotted versus the increasing number of images as shown in Figure 1. Figure saturates at a higher number of images inferred for categories. For these values graph consistently shows that models show higher accuracy for the female gender which could be an indication of the bias in the data.
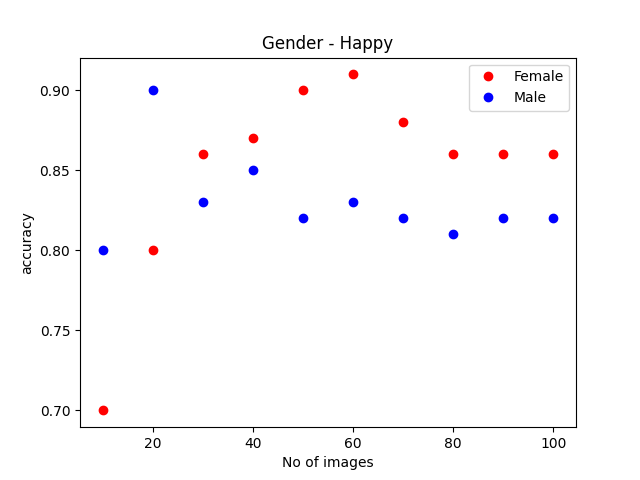
happylabel for the two genders considered.
Figure 2 shows the accuracy values plotted against the number of predictions for the other
labe for both genders. As in the case of the happy
category, the curves saturate at a value higher for the female
category showing a higher accuracy for the female gender. This might indicate a gender bias in the trained model.
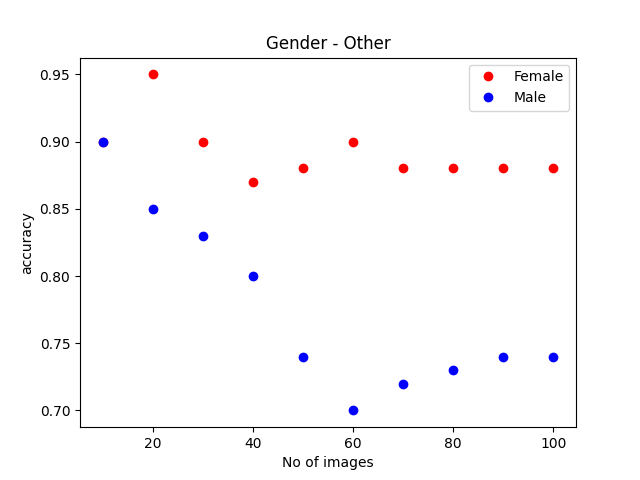
otherlabel for the two genders studied.
Skin Color
Here two skin colors - light vs. dark were used to compare the prediction results. Very dark and very light skin colors were chosen to keep the comparison simple. happy
faces were compared for the two skin colors. The results are shown in Figure 3. When we look at the figure, though it appears that dark skin color images perform better than lighter ones for the happy
label, the other
label results show the opposite behavior as demonstrated in Figure 4. To gather images for the happy
label most queries used the word laugh
to make the expression explicitly happy. This means that images showed the teeth
of the subject. The dark
skin color performing better in happy
label may be due to the contrast between white teeth and dark skin color. This is also corroborated by Figure 4 where we see light skin color performing better. Essentially these two figures do not conclusively indicate any bias.
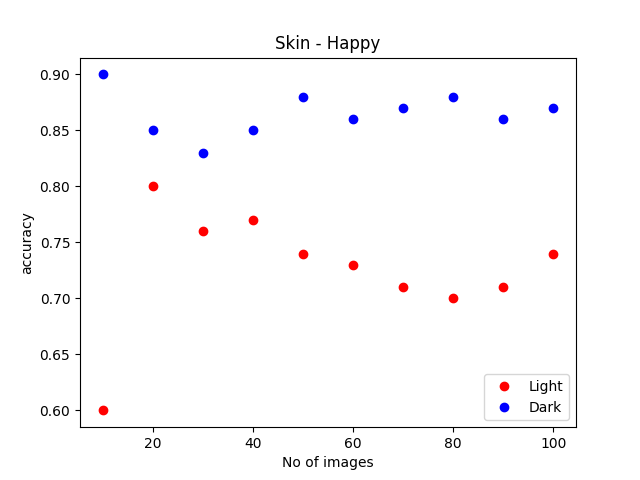
happylabel when skin colors are considered
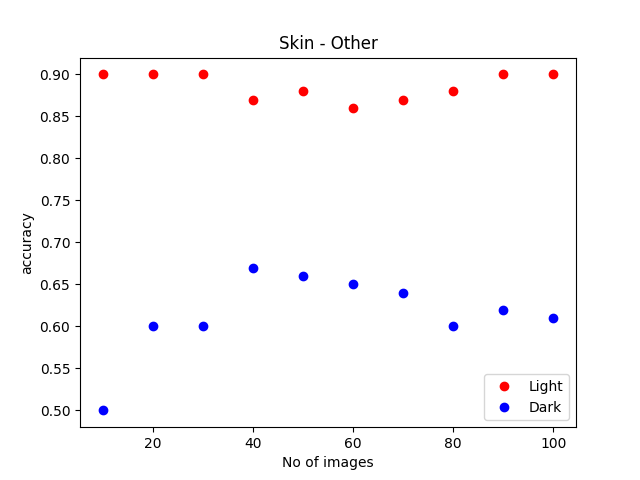
otherlabel
Age Group
Here we’ll study how the model works on the two age groups - kids/adults. Here the age gap is kept broad by choosing images of babies/toddlers and adults for simplicity. For the happy
label we obtain the results shown in Figure 5 where the accuracy is plotted for different numbers of images for both age groups. Here for higher image numbers, we don’t see much difference in accuracy between kids and adult images. On the other hand in Figure 6 for the other
label, we see that for higher image numbers kid images shows better accuracy than adult images. When searching for images for the other
label it was very easy to find close up image of kids sad/crying/making-faces and all those images fall in the other
label. Therefore Figure 6 might be pointing to bias in the model prediction.
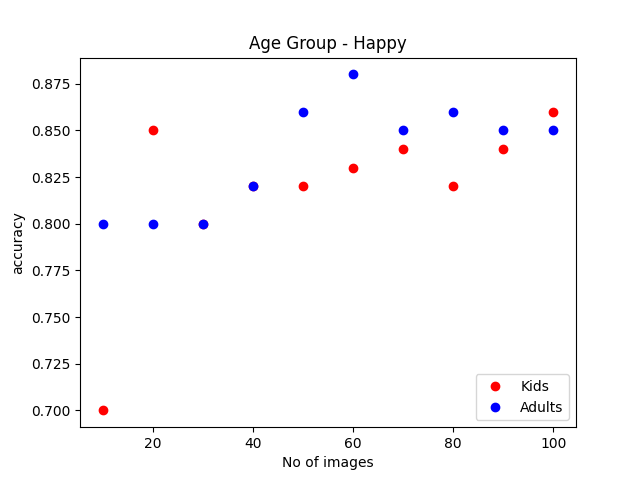
happylabel for kids/adults age group studied.
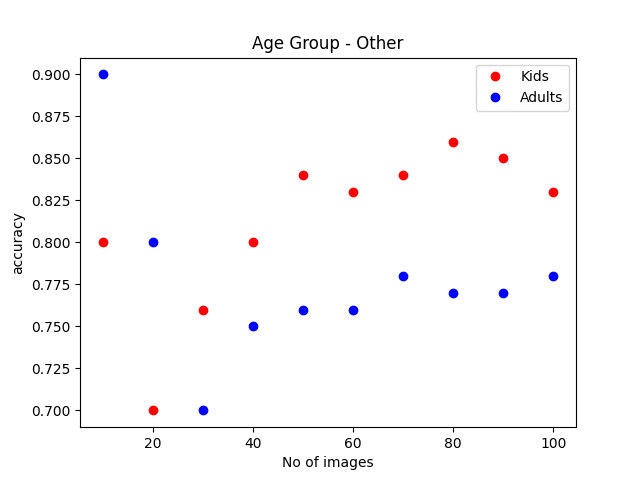
otherlabel in the kids/adults age group study.
Conclusions and Future Directions
This is a study aimed at understanding the importance of ethics in the deep learning field. As mentioned earlier this is an exercise in learning by a beginner and getting an idea of how ethics comes into play in this field and an exploration of ways to evaluate it on a project undertaken. As described in the results some of the data such as that from male/female category and kids/adults category show bias in the model prediction. Collecting data was a lot of work as it was easy to find different expressions for light
skinned person compared to dark
skinned. Somehow most of the images from places like Africa tend to show people with serious/sad faces. It was easier to find happy-white-man
rather than happy-black-man
. Happiness seems to be white-washed
on the internet. I was also going through conflict labeling images as male/female just by looking at the images which is far from accurate. I had similar issues labeling light/dark or deducing age just from images. How to perform a scientific study considering all these factors seems to be an interesting problem.